
Celebrating Connecticut’s Hispanic and Latino Residents
This week marks the end of Hispanic Heritage Month, a reminder for the nation to recognize and celebrate our Hispanic and Latino community members.
According to 1-year estimates from the 2021 American Community Survey (ACS), there are roughly 637,113 people of Hispanic or Latino ethnicity residing in Connecticut, accounting for 17.7% of Connecticut’s total population. Hispanic and Latino residents make up the state’s largest minority group.
In 2021, Connecticut ranked 11th in the country for the percentage of residents identifying as Hispanic or Latino. The percentage of Connecticut’s population of Hispanic or Latino descent was the highest among the New England states, and just behind New Jersey and New York in the region.
In this blog post, we share a profile of Connecticut’s large and vibrant Hispanic and Latino population using data from the 2010 and 2020 Decennial Census and the 2021 American Community Survey (ACS) 1-year estimates.

Source: U.S. Decennial Census, 2010 and 2020
Connecticut’s 30% growth outpaced the nationwide growth in the Hispanic and Latino population of 23% from 2010 to 2020.

Source: 2021 ACS 1-year estimates
The next most common origin groups were Dominican at 10.6% (± 1.4%), Mexican at 9.4% (± 1.4%), Colombian at 5.3% (± 1.0%), and Ecuadorian at 5.1% (± 1.0%).
See the searchable table below for the specific origins of Connecticut’s Hispanic and Latino residents as estimated by the U.S. Census Bureau from the 2021 ACS 1-year data.
In contrast, across the United States, the majority (59.5%) of Hispanic and Latino residents were estimated to be of Mexican origin. While Puerto Rican was the next largest origin group nationally, Puerto Ricans accounted for only 9.3% of all Hispanic and Latino residents in the U.S.
Connecticut had the highest percentage of residents identifying as Puerto Rican of any U.S. state. An estimated 8% (± 0.3%) of all of Connecticut’s residents of any race and ethnicity identified as Puerto Rican. The next closest states were Florida, New Jersey, New York, and Massachusetts, with roughly 5% of their residents identifying as Puerto Rican.

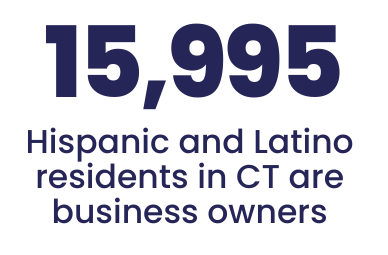
Source: 2021 ACS 1-year estimates Table S0201

Source: 2021 ACS 1-year estimates Table S0201
Source: 2021 ACS 1-year estimates Table S0201
FOR MORE INFORMATION
See the Census Bureau’s Facts for Features story for Hispanic Heritage Month for more information about the U.S. Hispanic and Latino population.
If you are interested in learning more about CTData, check out our mission and values and the services we provide. For training and tips on how to use data to inform your personal and professional life, register for one of our CTData Academy workshops or browse our blog. You can keep up with us by subscribing to the CTData newsletter and following us on Twitter, Facebook, and LinkedIn.