Demographics & Population Data

Datasets by CTData
Demographics & Population Datasets
NEW: CT Office of Early Childhood Local Needs Assessment Datasets 2026-05
This spreadsheet includes variables related to demographics & population, including data on the population of young children, family structure, birth rates, language, and more.
Population
Population by Age
Population by Race
Median Age
Veteran Status
Population Estimates Dashboard
Coming in 2026: Birth Data
Family Structure
Children by Family Type
Coming in 2026: Non-Working Parents
Coming in 2026: Single Parent Families
Households
Income
Projects by CTData

2020 Demographics and Housing Explorer
The 2020 Demographic and Housing Characteristics File (DHC), released by the U.S. Census Bureau in May 2023, is one of many data products released as part of the 2020 decennial census.

ACS 2021 Tool
Connecticut Measured By 2021 American Community Survey, 5-year estimates. This interface maps some of the most in-demand variables for Connecticut towns. See also ACS 2017, ACS 2018, ACS 2019 and ACS 2020 versions.

Aggregate Margins of Error
Combine many estimates with margins of error into one aggregated estimate with a new margin of error.

CONNECT Regional Data Stories
Seven data stories about who lives and works in Connecticut, some of their educational experiences, and health outcomes.

County Stories
See how the 8 Connecticut counties compare in demographics and economy.

DMHAS Regional Data Stories
Regional interactive data stories show cross-sector data that describe general characteristics of each of five DMHAS regions.

Hartford Data Platform
A geospatial analysis that maps Hartford housing conditions with the 500 Cities dataset of health outcomes, to better understand which neighborhood conditions could be improved.

NEW: Hartford Neighborhood Data Platform
The Hartford Neighborhood Data Platform (HNDP) is a data exploration tool developed by CTData Collaborative to empower city and community organizations, policymakers, and residents with access to neighborhood-level data. It supports informed decision-making and promotes equitable community development in Hartford, Connecticut. Learn more in the “About the Dashboard” tab below.

NEW: Hartford Young Children Data Story
An overview of young children in Hartford in an accessible format that is easy to navigate.

Living IN An Aging CONNECTICUT
Can Connecticut meet the needs of its changing demographics? And will we leverage the opportunities that come with ever-increasing numbers of older adults looking for ways to contribute their skills, talents and experience?

Women & Girls Data Platform
An online, interactive tool to provide access to publicly available data specific to regional, city, and statewide levels and aggregated for gender and race.

Town Profiles
Two-page PDF reports of demographic and economic information for Connecticut's towns.
CTData Blog Posts
In March, the Census Bureau released its Vintage 2025 County Population Estimates – which, in Connecticut, are for our nine “county-equivalent” planning regions. The data include annual total population estimates for states and counties or county-equivalents for July 1, 2020, to July 1, 2025, as well as estimated “components of change” – births, deaths, and migration – between each year.
Read on to learn about how Connecticut’s population has changed, overall and by planning region.
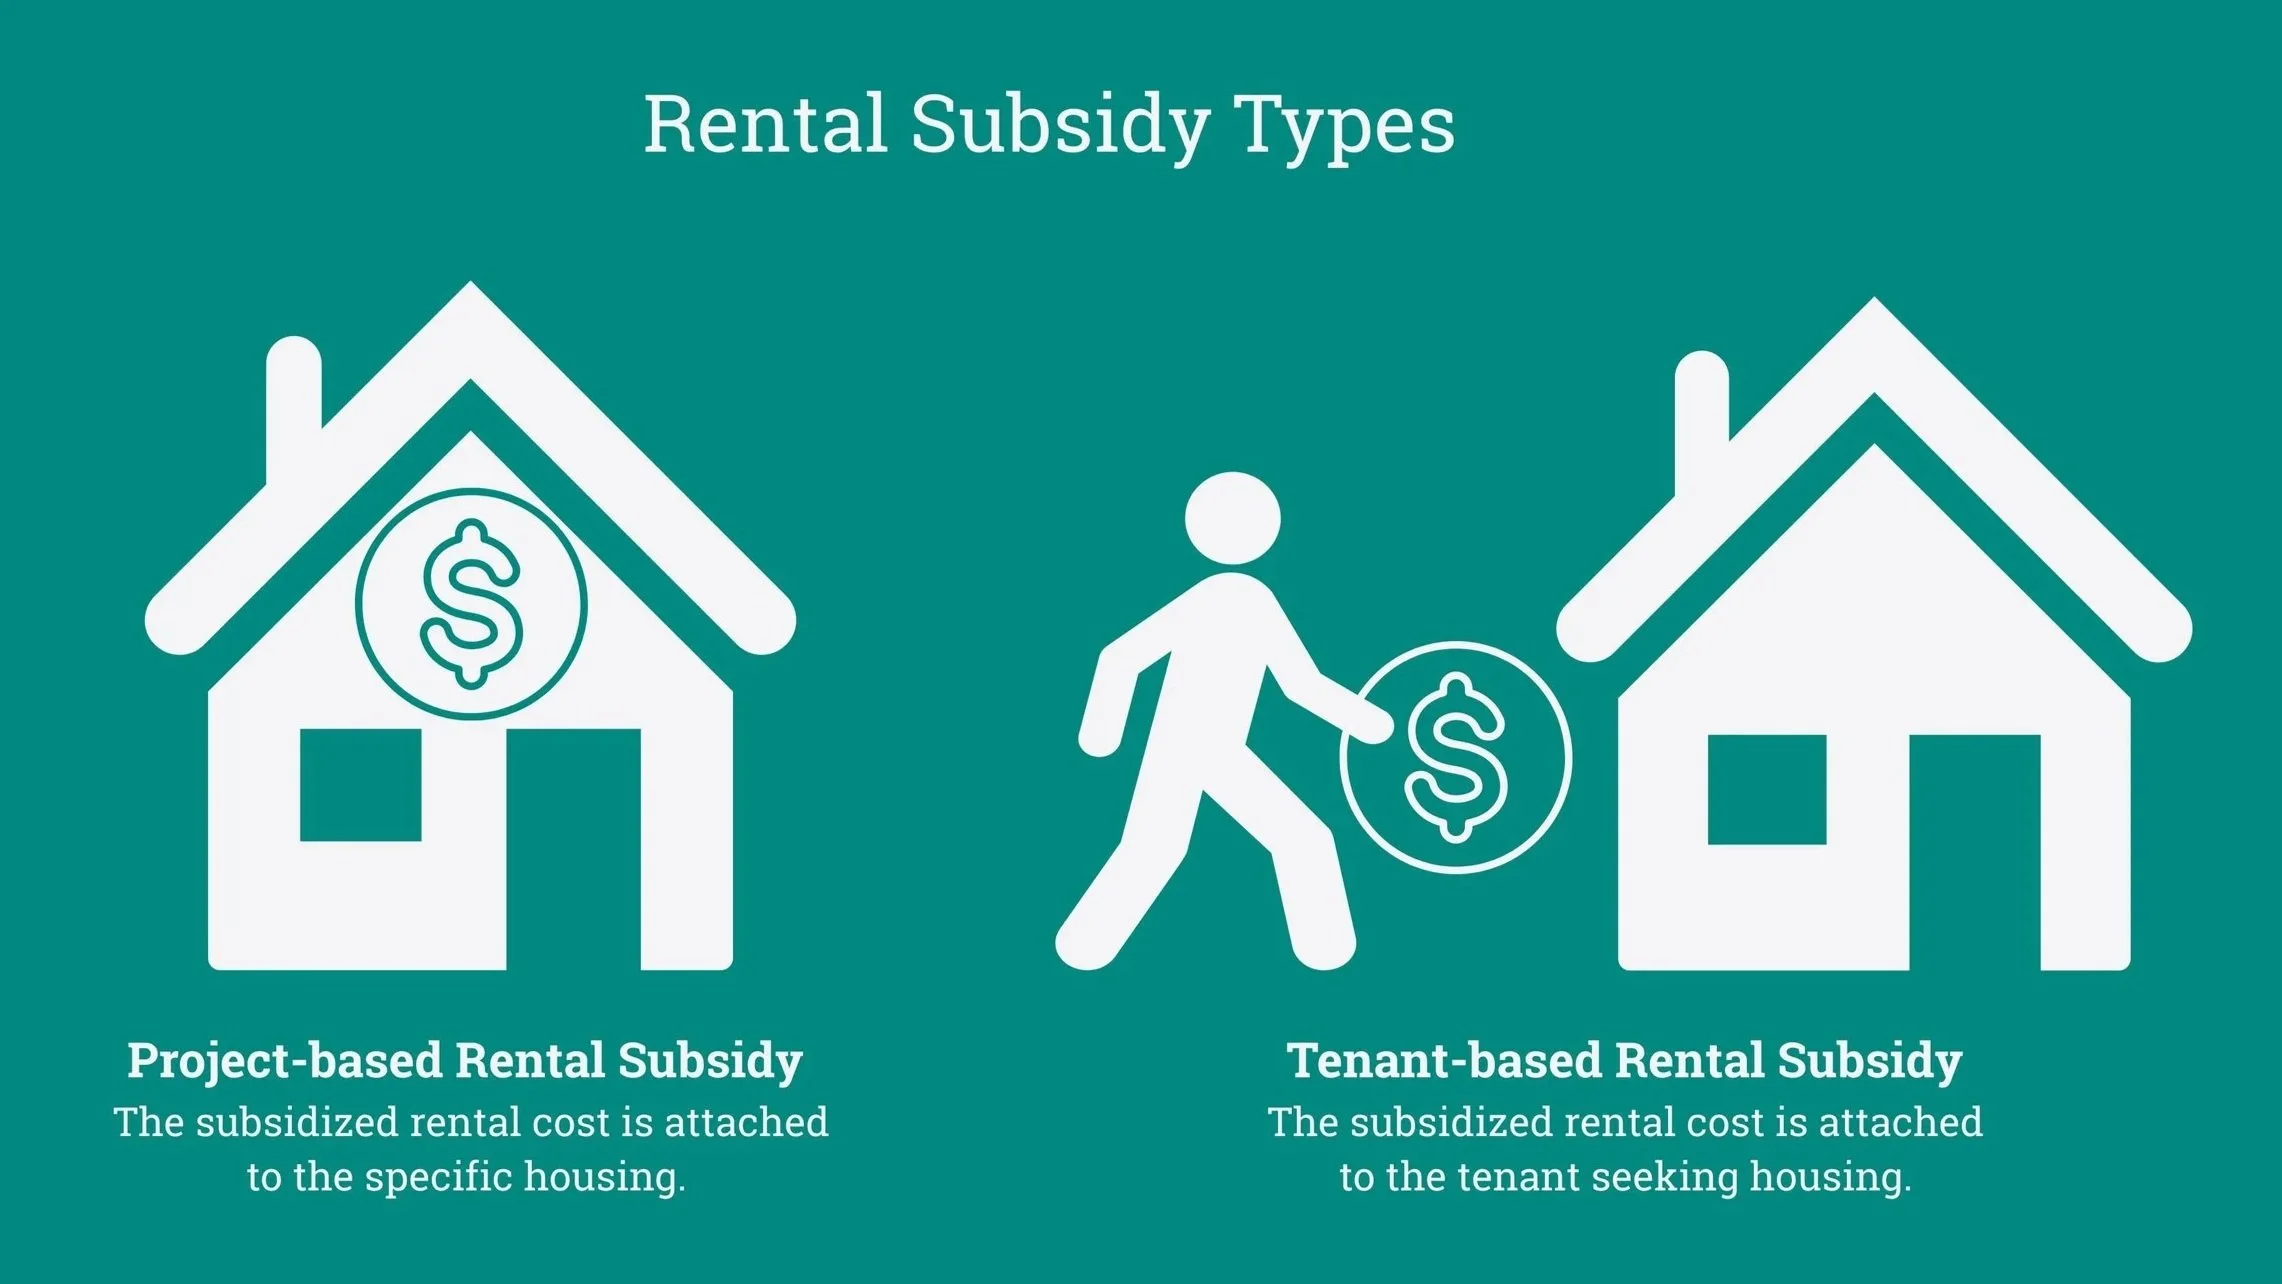
In Connecticut there are 480,258 households who rent their homes. Based on household income, as many as 367,252 households may qualify for a rental subsidy. Meaning more than 75% of rental households may qualify for a rental subsidy if there was enough subsidy available.

On December 19th, 2024, the U.S. Census Bureau released their vintage 2024 population estimates for the nation and states. This estimates series incorporates a methodological change to how the Census Bureau estimated net international migration, resulting in substantially higher nationwide estimates of net international migration over the last several years.
On September 23, 2024, we introduced our new 2024 Population Estimates Dashboard through an informational webinar. This powerful tool provides easy access to Connecticut census data from 2020 to the present for each of the state's towns and planning regions, marking a significant step forward in making vital demographic information easily accessible to the public, researchers and policymakers.
In May of 2024, the U.S. Census Bureau’s Population Estimates Program (PEP) released their vintage 2023 population estimates for Connecticut’s towns. However, there are some important caveats to keep in mind when interpreting Connecticut’s population estimates. In this blog post, we discuss some errors and adjustments in the Census Bureau's population estimates for Connecticut and provide guidance for data users.
Last month, the Census Bureau released an erratum informing the public that they had made a data processing error in the 2022 ACS domestic migration estimates for Connecticut and that data users should not use these migration estimates. This blog post discusses what happened, what data products were affected, and what data users should do.

The blended base is the estimate of the national, state, and county populations by age, sex, race, and Hispanic origin as of April 1st, 2020, that the Census Bureau has used in their population estimates since the 2020 Decennial Census. The blended base uses population totals from the 2020 Decennial Census, but the distribution of the population by age, sex, race, and Hispanic origin comes from other data sources.
In this blog post, we will:
Provide an introduction to the blended base and why it matters
Compare Connecticut’s blended base population estimates by age and sex to the 2020 Decennial Census counts for the state
Discuss the future of the population estimates base
Dive into more details on the blended base methodology for those who are interested

Last week the Census Bureau announced that it will implement updated standards for the collection and reporting of race and ethnicity data set by the Office of Management and Budget (OMB) that are effective as of March 28th, 2024. This is the first time the OMB’s race and ethnicity data standards have changed since 1997. Read more.
Census Bureau data products continue to give insight into changes in mortality trends over the past few years and through the Covid-19 pandemic. Vintage 2022 Population Estimates, which are based on data from the National Center for Health Statistics, take into account final 2021 and provisional 2022 mortality data and allow data users to look at mortality by sex and by race and ethnicity.
To celebrate Native American Heritage month, we explored the Decennial Census data files to find some data on Native Americans living in Connecticut. In this post we share what we found about the tribes with the highest populations in Connecticut, demographics of the Native American population in Connecticut, and where Native populations live across the state.

Connecticut’s Department of Public Health (DPH) has determined that the Census Bureau’s vintage 2022 population estimates are artificially high for certain Connecticut towns in 2021 and 2022 due to pandemic-related issues with the counts of residents in group quarters facilities.
This blog post:
discusses what happened;
explains the impact on population estimates for specific towns, planning regions and the state;
delineates which population estimates the state will be using for official purposes; and
provides some recommendations for data users on which version of the population estimates to use, and where to find these estimates.

The 2020 Demographic and Housing Characteristics File (DHC), released by the U.S. Census Bureau in May 2023, is one of many data products released as part of the 2020 decennial census. The DHC file includes detailed tables on topics such as age, sex, race, ethnicity, along with many topics about households and families.
The raw data can be downloaded on the Census Bureau’s website, but CTData has created a 2020 Demographics and Housing Explorer for data users to easily access and explore data found in the DHC file. Click the button or preview below to explore data for your town!
According to the 2020 decennial census, Connecticut has approximately 1.4 million households, of which 3.9%, or 55,526, are multigenerational. This marks an increase of about 0.3%, or 4,924 households, from the 2010 decennial census. In comparing the change from 2010 to 2020, every planning region in Connecticut experienced an increase in multigenerational households. The smallest increase was in the Lower Connecticut River Valley, with 77 households, or 4.3%, while the largest was in Western Connecticut, with 1,683 households, or 23.5%.

Accurate population estimates are vital for informed decision-making and planning for the future. The U.S. Census Bureau produces annual population estimates that provide valuable population insights. This blog post explores the methodology utilized by the Census Bureau to produce these estimates, highlighting the data sources, statistical techniques, and considerations on when to use them.
Accurate and reliable population data is essential as we strive to understand our communities and plan for the future. From determining congressional districts to allocating resources for schools and healthcare, population data drives decision-making at all levels of government and beyond.
In this blog post, we'll take a closer look at four commonly used sources of population data: the Decennial Census, American Community Survey (ACS), Population Estimate Program (PEP), and Connecticut Department of Public Health (CT DPH) Population Estimates. Continue reading to learn more about these sources.

To protect respondents’ privacy, for the 2020 Decennial Census the Census Bureau is using a modern disclosure avoidance approach called differential privacy. In brief, differential privacy adds statistical noise—small random additions or subtractions—into the data to reduce the risk that someone could reidentify any person or household.
In this post, we will: (1) describe how differential privacy is applied to the 2020 Decennial Census data; (2) review the Census Bureau’s guidance for 2020 Decennial Census data users; (3) provide an overview of the summary metrics file released by the Census Bureau; and (4) discuss some illustrative examples of the amount of error introduced to certain counts as reported in the summary metrics file.
The United States Census Bureau’s Population Estimate Program released its Vintage 2022 population estimates for towns in Connecticut for July 1, 2022. Bridgeport remains in the top spot, with the highest population at 148,377 people (an increase of 0.14%), but Mansfield’s population data showed the largest increase. Click to explore more.

In 2020, the Census Bureau made some important changes to how they collect and process race and ethnicity data. These changes were intended to better capture the increasingly diverse racial and ethnic identities of the U.S. population, while still following the 1997 Federal Office of Management and Budget (OMB) Standards for the Classification of Federal Data on Race and Ethnicity. However, these changes also raise some questions about the validity of the Census Bureau’s “Two or More Races” classification in 2020, particularly for Hispanic and Latino individuals. They also complicate comparisons with race data from before 2020, making it difficult to assess change over time. In this blog post, we discuss the consequences of the Census Bureau’s recent changes to how they collect and process race and ethnicity data, as well as the proposed revisions to the OMB standards for the classification of federal data on race and ethnicity.
Today, the Census Bureau released the first postcensal population estimates for Connecticut’s nine planning regions. These nine planning regions are the new county-equivalent geographic units that the Census Bureau will be using for Connecticut (see our earlier blog post on this topic). This is the first Census Bureau data product to be released using Connecticut’s new county-equivalent geographic units.
At CTData, we often receive questions about changes in migration patterns before and after 2020 and the COVID-19 pandemic. Using three data sources from the U.S. Census Bureau, this blog post will look at recent migration patterns in Connecticut.

The 2020 Decennial Census faced unprecedented challenges: the COVID-19 pandemic, political interference, natural disasters, and the implementation of a new approach to privacy protection called differential privacy. We invited two experts to share what this means for using Census 2020 data. Amy O’Hara is a Research Professor in the Massive Data Institute and Executive Director of the Federal Statistical Research Data Center at Georgetown University. Elizabeth Garner is the State Demographer at the Colorado State Demography Office.
National Disability Employment Awareness Month is observed annually in October, recognizing people with disabilities' essential roles in a diverse and inclusive American workforce.
From the American Community Survey, 5-year estimates for 2016-2020, we looked at three data tables for Connecticut's population with a disability: population, employment, and median earnings. Below are some of the highlights from the data.

This week marks the end of Hispanic Heritage Month, a reminder for the nation to recognize and celebrate our Hispanic and Latino community members.
In this blog post, we share a profile of Connecticut’s large and vibrant Hispanic and Latino population using data from the 2010 and 2020 Decennial Census and the 2021 American Community Survey (ACS) 1-year estimates.

The Covid-19 pandemic has impacted the lives of Connecticut residents in many ways, from introducing many workers to remote work to exacerbating the financial struggles of others. Last year, the U.S. Census Bureau announced that standard 2020 ACS 1-year estimates would not be released, as Covid-19 severely impacted the data collection process and ultimately resulted in estimates that did not meet the Census Bureau’s Statistical Data Quality Standards. The Census Bureau was able to work through data collection challenges this year and released ACS 2021 1-year estimates on September 15, 2022.
In this post, we analyze changes from pre-pandemic (2019 ACS 1-year estimates) to the most recent time frame of data we have (2021 ACS 1-year estimates) to explore the impact of the pandemic on Connecticut residents and workers.
Today, the Census Bureau released 2020 undercount and overcount rates by state from the Post-Enumeration Survey (PES). The PES measures the accuracy of the decennial census by surveying a sample of the population to estimate the proportion of people missed or counted erroneously during the census count.

May is Asian/Pacific American Heritage Month – a celebration of Asians and Pacific Islanders in the United States. In Connecticut – according to the 2020 U.S. Census – the Asian/Pacific American population grew by 27.1% during the past decade, from 134,091 residents in 2010 to 170,459 in 2020.
When comparing the 5-year estimates of American Community data between 2011-2015 and 2016-2020, CTData has found:
A majority of towns experience a decrease in population
Home values decrease while rent increases
Women continue to earn only 80 cents on the dollar compared to men
Education levels have increased
Working from home is becoming increasingly common
Explore the data, as well as more topics, with this ACS 2020 roundup!
Over the past several months, we have explored population changes in Connecticut from 2010 to 2020, touching on topics such as overall changes, diversity, housing, analysis for specific towns, and more. In this short blog post, we explore population changes by race and ethnicity for each of the “Five Connecticuts,” a system developed by the University of Connecticut.

Last week, CTData was approached by an organization that was looking to explain the decline in the youth population between 2010 and 2020, particularly the declining numbers of white youth. We decided to share our findings publicly in this post.
How do Connecticut’s Census 2020 numbers compare to the rest of the country? Read on for some highlights.