
Arrests by Immigration and Customs Enforcement Increase Significantly in Connecticut in 2025
In recent months, there has been an increase in Immigration and Customs Enforcement (ICE) activity in the country as well as in Connecticut, including a high-profile story of the arrest of an Afghan interpreter for the US military who had fled the Taliban and resettled in Connecticut.
We wondered, to what extent has this activity increased and what do we know about it?
Using data from the Deportation Data Project, we explored a few basic questions to get a clearer picture.
A quick note about the data: The dataset we used showed ICE arrests and related activity in Connecticut starting in September 2023 and ending in July 2025. More about this dataset and how we used it can be found at the end of this post.
What have arrests and detentions looked like over the past two years in Connecticut?
Between January and July 2025, ICE arrests and deportations have doubled compared to the same timeframe in 2024. ICE arrests in Connecticut have increased from 247 in all of 2024 to 405 in the first seven months of 2025. Deportations increased, from 142 in all of 2024 to 164 as of July 2025.
Since the new administration took over in January 2025, arrests began rising sharply (with the exception of May).
While we see spikes at various points in the data, only two months of 2025 were lower than any month in the past two years (January and May 2025; see Table 1 and Chart A). The remaining five months were higher than any month the previous two years.
Deportations in 2025 have also reached higher monthly levels than any month in 2024 (see Chart A). Deportations are removals of individuals who were arrested, went through removal proceedings, and were ordered to be removed by immigration court.
Average monthly arrests have tripled and deportations have doubled in 2025 (Jan-July) compared to all of 2024.
Average monthly arrests increased from 21 in 2024 to 58 in 2025. This is an average increase of 37 arrests per month.
Average monthly deportations increased from 12 in 2024 to 23 in 2025. This is an average increase of 11 deportations per month.
Where were people arrested?
The data includes three main categories for method of apprehension – Located, Non-Custodial Arrest, and Incarceration. According to the Deportation Data Project, Non-Custodial Arrests and Located designations are “likely” arrests that took place in the community, rather than in a jail or prison. To simplify this distinction, we have combined these two categories into a single “community arrests” category, which we will use throughout the rest of this analysis.
As shown in Chart B, community ICE arrests increased signficantly from 2024 to 2025, while arrests of people who were already in jail or prison decreased.
Community arrests accounted for 67% of ICE arrests in 2024, rising to 88% in 2025 (Jan-July).
Average monthly community arrests and deportations that originated from community arrests have more than tripled in 2025 (Jan-July) compared to all of 2024:
Average monthly community arrests increased from 14 in 2024 to 51 in 2025. This is an average increase of 37 arrests per month.
Average monthly deportations that originated from community arrests increased from 6 in 2024 to 20 in 2025. This is an average increase of 14 deportations per month.
In total, 32 Connecticut towns had ICE arrests in 2025.
Community arrests and deportations that originated from community arrests have been highest and increased the most in Hartford (see Table 2 and 3). In the first 7 months of 2025, the average number of monthly arrests and deportations in Hartford have nearly tripled, compared to all of 2024.
Average monthly arrests in Hartford increased from 10 in 2024 to 28 in 2025. This is an average increase of 18 arrests per month.
Average monthly deportations in Hartford increased from 4 in 2024 to 11 in 2025. This is an average increase of 7 deportations per month.
Who has been arrested?
The criminal conviction status of those arrested by ICE has shifted over the past three years (see Chart C). Between September and December of 2023, nearly half of arrests involved people whose only violation was immigration related (49%), with no criminal conviction or pending criminal charge. In 2024, the largest share of ICE arrests shifted to people with a criminal conviction (47%). So far in 2025, the majority of arrests has shifted again, with most arrests involving people with pending criminal charges (50%), meaning they have been accused but not convicted of a crime.
Looking at the absolute numbers (see Chart D), ICE arrests in 2025 show that those with criminal convictions (106 people) and those with only immigration violations (“other immigration violator” in the data, 98 people) are fairly even. The largest increase is among people with at least one pending criminal charge with no conviction. In the first 7 months of 2025, ICE made 201 such arrests - more than four times the total in all of 2024 (45 arrests).
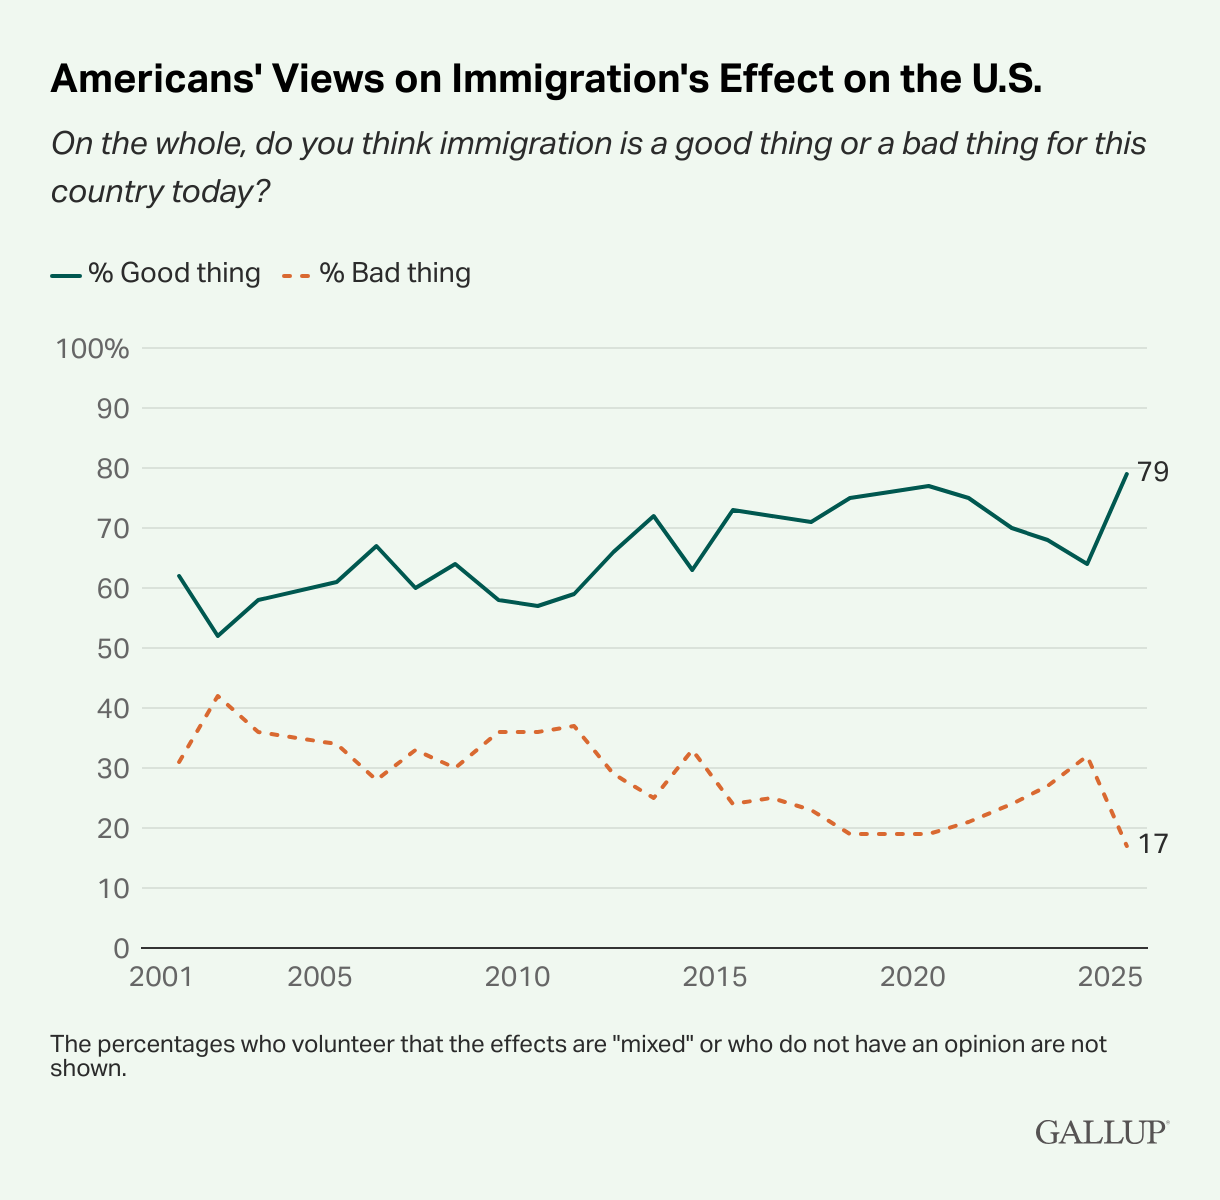
Line chart showing Americans' views on immigration from 2001-2025, based on Gallup polling asking whether immigration is good or bad for the country. Two trend lines show: the percentage viewing immigration as good (solid teal line) and bad (dashed orange line). The 'good' percentage starts around 62% in 2001, dips to about 52% in 2002, then generally rises with fluctuations to peak around 77% in 2020 before dropping to 65% in 2023 and increases to 79% in 2025. The 'bad' percentage is the inverse of the ‘good percentage line,’ so if combined, they would total 100% for each timeframe. Throughout the period, more Americans consistently view immigration as good rather than bad, with the gap widening most significantly by 2025. Note states “The percentages who volunteer that effects are “mixed” or who do not have an opinion are not shown.” For more information, there is a link to this Gallup article in the blog post.
What does the public think about this increased activity?
While the purpose of this analysis is to look at the numbers in Connecticut, which can inform the public, legislators, and advocates, we were also curious what the public thinks about this increased activity.
While we do not have Connecticut-specific polling on this topic, Gallup has polled Americans for many years on their view of how much immigration we should have, whether immigrants are good for the country, and the kinds of policy proposals the public prefers. This article can provide additional insight into the context of this issue.
About the Data
The Deportation Data Project “collects and posts public, anonymized U.S. government immigration enforcement datasets.” They explain that they, “use the Freedom of Information Act to gather datasets directly from the government.”
The dataset includes data from September 2023 to July 2025. Therefore, 2024 statistics include the entire year, while 2023 and 2025 data only include the months available (2023 has September through December and 2025 has January through July).
In our analysis, we utilized just a few of their variables, including:
Arrests. These are arrests by ICE. They include arrests that result in a release, a detention, or a deportation.
Deportations. Removals of individuals who had been arrested were removed from the US.
Apprehension method
CAP Federal, State, or Local Incarceration are arrests made while the person was in criminal custody of a federal/state prison or a local jail.
Located and Non-Custodial Arrest are believed by the Deportation Data Project to represent arrests made in the community. To simplify this distinction, we have combined these two categories into a single “community arrests” category.
Apprehension criminality
Criminal conviction means an individual has at least one criminal conviction.
Pending criminal charge means an individual was charged with, but not convicted of a crime.
Only immigration violation (“other immigration violator” in the data) means the individual was arrested for an immigration violation, not potentially criminal activity.
For More Information
Explore other data sets and analysis at data by topic and data projects, explore the resources we provide, or sign up to receive information about workshops, data releases, blog posts and more in our newsletter. For training and tips on how to use data, register for one of our CTData Academy workshops or browse our blog. And be sure to connect on Facebook, LinkedIn, Instagram, and Bluesky.