
Some Fairfield Cities May Be Flattening the COVID-19 Curve
Given our close proximity to New York state, Connecticut has been hit hard by COVID-19.
In fact, a recent New York Times article reported four of Connecticut’s metro areas in the top 15 nationally for the number of new deaths in the last two weeks: Fairfield County (#2), Hartford (#3), New Haven (#6), and Torrington (#11). Statewide, the number of confirmed cases continues to climb as testing becomes more accessible. As of Monday, April 27, Connecticut had 90,746 tests completed; 25,997 confirmed cases; 1,758 hospitalizations; and 2,012 deaths. On average, per 1000 residents, that is approximately 25.34 tests, 7.26 confirmed cases, 0.49 hospitalizations, and 0.56 deaths.
One of the most frequently asked questions right now is whether the COVID-19 curve is flattening. Policymakers and residents alike are anxious to see the numbers of confirmed cases and hospitalizations level out and then begin to drop, as this will help inform steps to reopen the state and lessen social distancing restrictions.
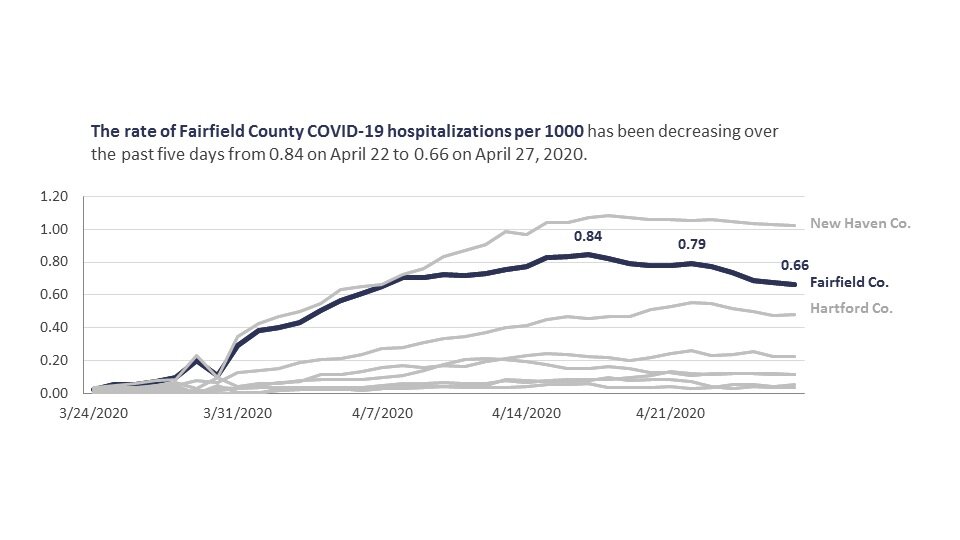
County-level hospitalizations suggest that Fairfield, New Haven, and Hartford counties are all beginning to see a decrease in COVID-19 hospitalizations. Fairfield County, which has reported the highest level of confirmed cases and hospitalizations, has reportedly discharged 122 patients in the last five days. While Fairfield County has the most number of people hospitalized, New Haven has a higher rate of hospitalizations per 1,000 people.
However, county-level data for the rate of confirmed cases per 1,000 people suggests that most counties are still increasing. As of April 27, 2020, Fairfield County had a rate of 11.40 confirmed cases per 1000 people, while the rate for New Haven was 8.04 and 5.76 for Hartford.

When the data is disaggregated by town it begins to tell a different story. Looking at Fairfield County, which has seen the most confirmed cases in the state at 11.15 cases per 1,000 residents (10,763 confirmed cases as of April 27, 2020), we can see that some towns are beginning to flatten the curve. The towns of Bethel, Danbury, and Norwalk experienced the highest rates of COVID-19 per 1,000 and are each seeing a leveling out of the curve. However, towns such as Bridgeport, Fairfield, and Stamford are still reporting increases in cases.
Data for each of the small multiple line charts below comes from the CT Department of Public Health and shows the rate per 1,000 residents between March 21, 2020 and April 26, 2020 (compared to an end date of April 27, 2020 for the other two charts). To calculate the rate per 1,000, population estimates for each town were pulled from the American Community Survey 5-year estimates from 2014-2018.
Click the image to enlarge.
Many of us are looking forward to the day when Connecticut reopens, but in order to safely do so, we need to look at the data. While some cities are flattening the curve in terms of confirmed cases, we should remember that reopening the state will be a collective effort that requires patience, personal responsibility, and accurate information.
The data in this blog highlights confirmed cases but that is not the only metric Connecticut will use to inform how and when the state will lessen social distancing measures. A recent CTMirror article reported that, “Lamont says he would like to see 14 days of declining hospitalizations and new cases. COVID-19 hospitalizations, which Lamont says is his key metric, totaled 1,758 on Monday [April 27, 2020], down 8 from Sunday and well within the capacity of the state’s hospitals. There were 74 deaths, bringing the total associated with the coronavirus to 1,998.”
If you’d like to keep track of your city or town’s progress towards flattening the curve, head to our COVID-19 Case Tracking Dashboard and select your town or city to see how the number of confirmed cases has changed over time. For more data updates, sign up for our newsletters, and follow us on Facebook, Twitter, and LinkedIn.