
W.E.B. Du Bois Data Portraits as Lessons for Equitable Data Work | Equity in Data Community of Practice
In a recent session of the Equity in Data Community of Practice, we reflected on the legacy of W.E.B. Du Bois’s groundbreaking data visualizations. Below is an overview of what we discussed, a recording of the session and our speaker’s bio.
At the 1900 Paris Exposition, Du Bois displayed over 60 hand-drawn, color data visualizations to document the progress, education, and socioeconomic conditions of Black Americans following emancipation. A pioneer sociologist and data visualization designer, Du Bois used data to tell powerful and intentional stories that we can continue to learn from.
During this session, Dr. Whitney Battle-Baptiste joined us to reflect on these visualizations through W.E.B. Du Bois’s Data Portraits (2018), the collection she co-edited. Together, we explored what Du Bois's data work teaches us about centering people in our data stories, using data as a tool for liberation and advocacy, and designing with a clear understanding of audience and purpose.
You can watch the full recording of the session below.
Speaker Bio: Whitney Battle-Baptiste is a Professor in the Department of Anthropology and Director of the W. E. B. Du Bois Center at UMass Amherst. A native of the Bronx, New York, Dr. Battle-Baptiste is an activist-scholar who sees the classroom and campus as spaces to engage contemporary issues with a sensibility of the past. Her academic training is in Black study, history, and historical archaeology. Her research critically engages the interconnectedness of race, gender, class, and sexuality through an archaeological lens. Her books include Black Feminist Archaeology (2011) and W. E. B. Du Bois’s Data Portraits: Visualizing Black America (2018), co-edited with Britt Rusert. She is currently completing the second edition of Black Feminist Archaeology with Routledge and a co-edited volume tentatively titled The New Vanguard, New Directions about W. E. B. Du Bois with the University of Massachusetts Press.
Front cover of “W.E.B. Du Bois’s Data Portraits: Visualizing Black America”
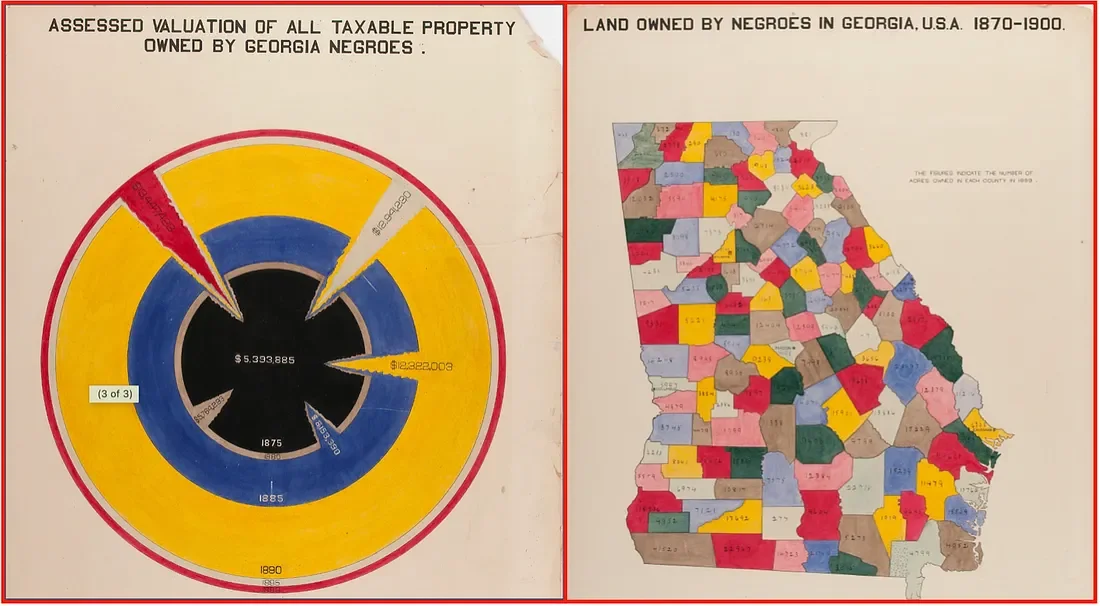
Two visualizations. The left visualization shows a circular chart with each ring showing a different year of taxable property owned by Black residents in Georgia. On the right is a color map that depicts land-owned by Black residents in Georgia.
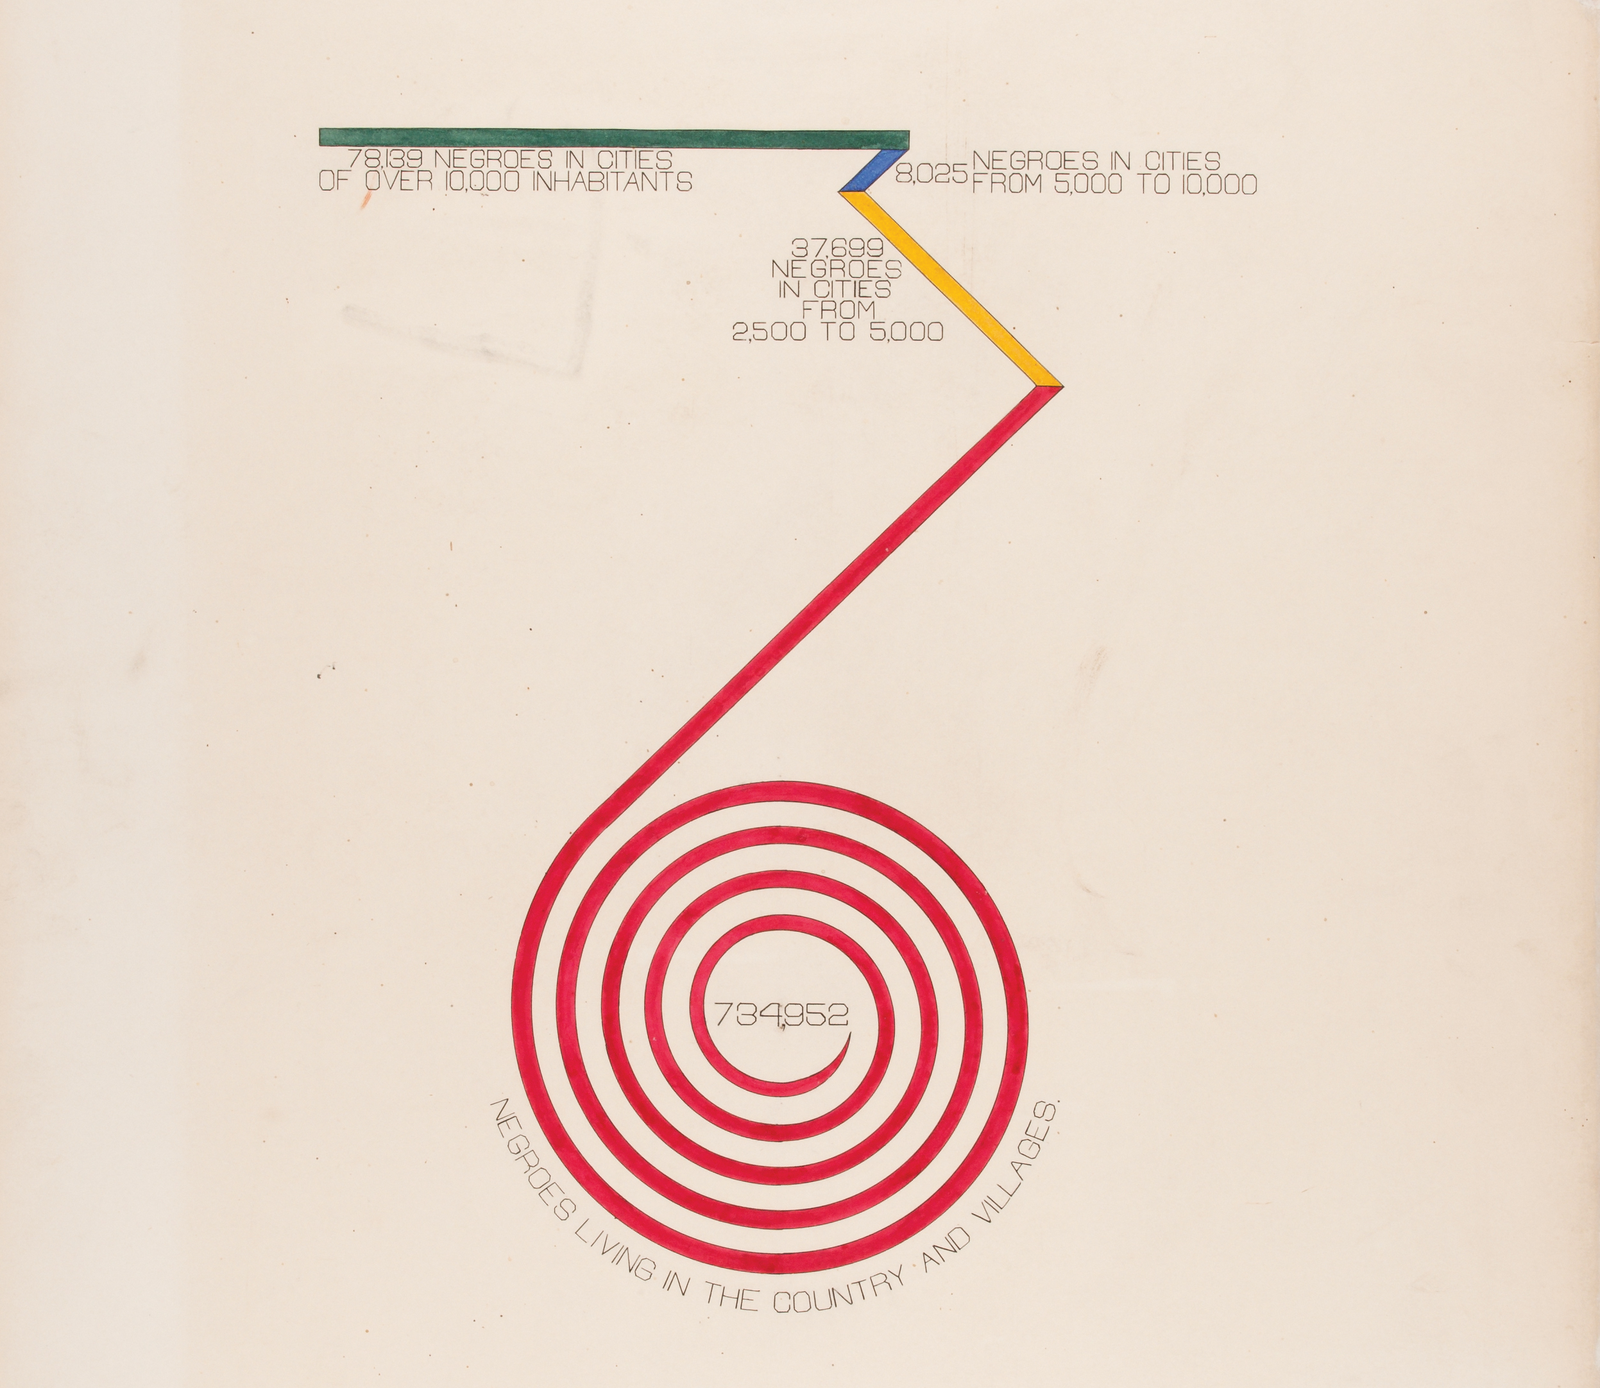
A part-to-whole visualization that breaks out the Black American population by where they live.
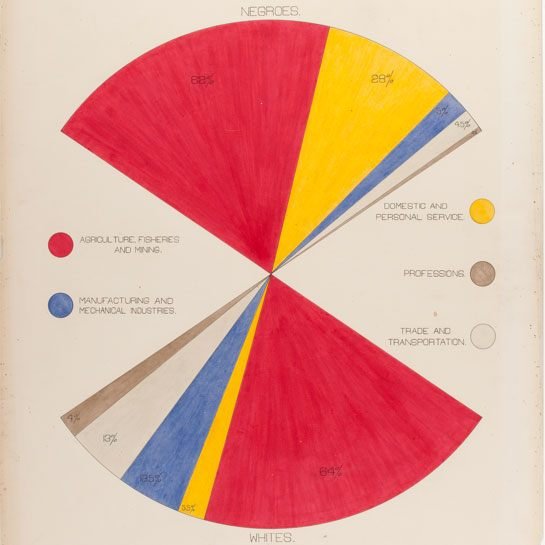
A handdrawn part-to-whole chart showing professional industries residents work in by race.
For More Information
Explore other data sets and analysis at data by topic and data projects, explore the resources we provide, or sign up to receive information about workshops, data releases, blog posts and more in our newsletter. For training and tips on how to use data, register for one of our CTData Academy workshops or browse our blog. And be sure to connect on Facebook, LinkedIn, Instagram, and Bluesky.